Research in Glioblastoma
As you know we are working on the new version of Glioblastoma Navigator. The system will be a leap forward compared to what is currently available thanks also to new technologies. To achieve this result, we are analyzing all possible sources of information and certainly a very rich source is the clinical trials database clinicaltrials.gov.
We therefore asked ourselves, how much research is actually done and of what type? The following graph tells us how many clinical trials have been conducted since the clinicaltrials.gov database began collecting this information.
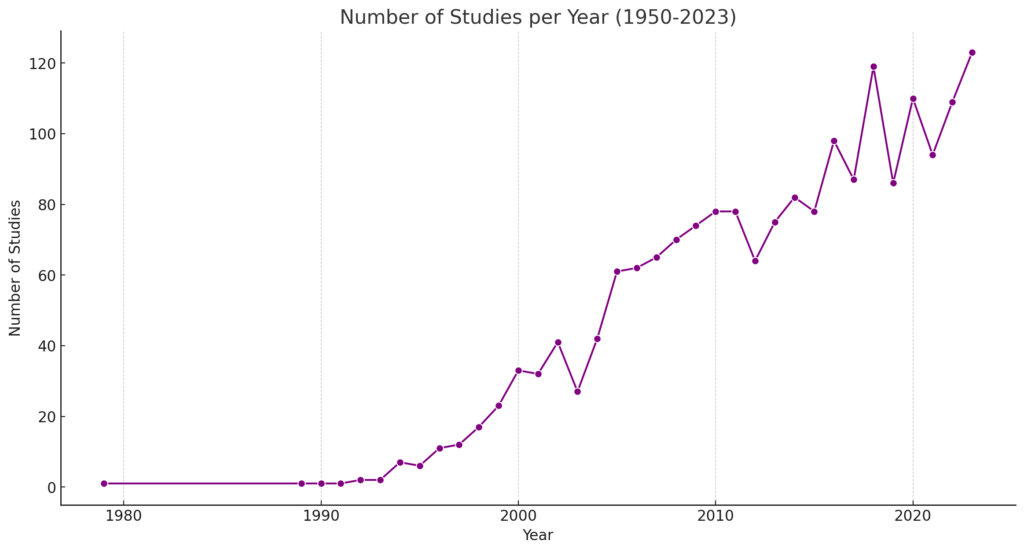
As you can see, the number of experiments is constantly growing, and this is precisely what we want because the more research we do, the closer we come to understanding how to treat the “Perfect Storm” as we have called glioblastoma several times.
Among this research it is important to understand how much research is done in Italy. The following graph gives us an answer, even if partial, because these are only the studies resulting from the clinicaltrials.gov database where registration by European research institutes is not mandatory. What do you think? I would like these numbers to be higher.
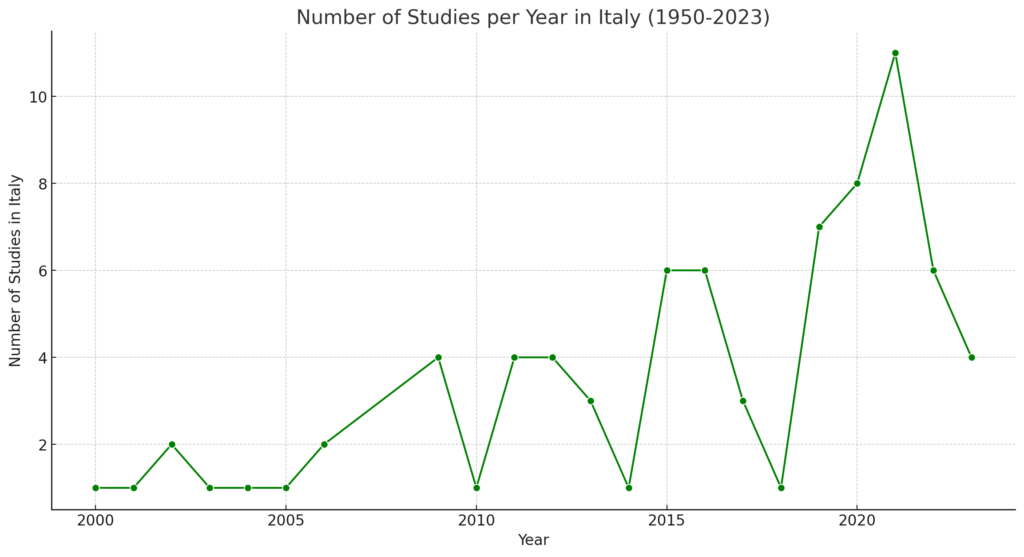
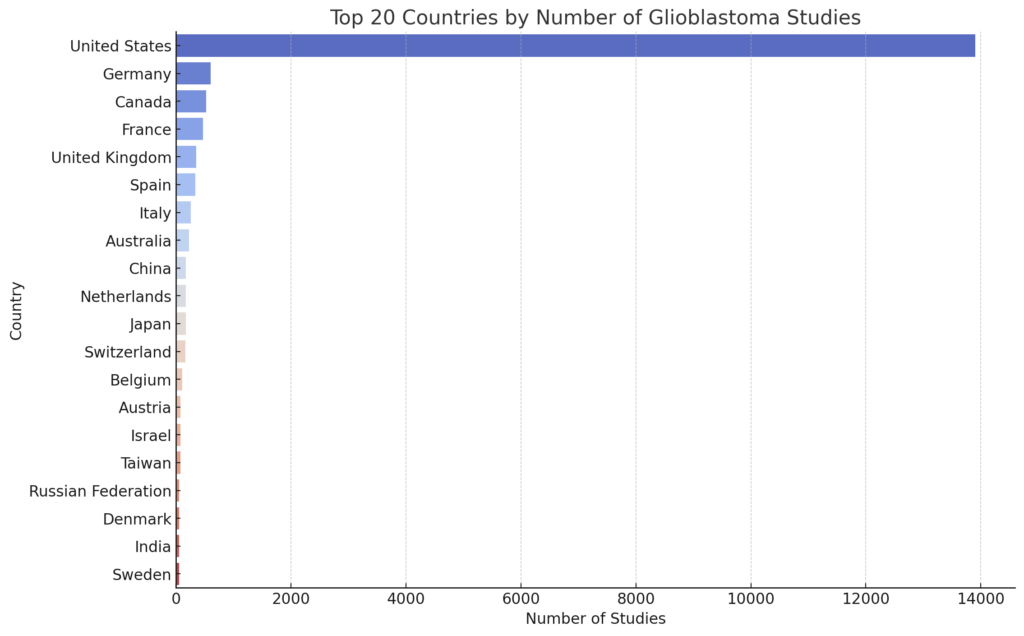
To have more complete information, it is our intention to also include the data registered in the European clinical trials database clinicaltrialsregister.eu and perhaps also the data from the National Clinical Trials Observatory managed by AIFA although frankly as a patient or caregiver and specialist I would like find everything in a single easy-to-consult database. As for the geographical distribution of searches, however, we are not in a bad situation.
It is also interesting to understand the distribution by research phases. As you know, from the pre-clinical research phase, which means that the research is conducted in the laboratory, we move on to clinical research which goes from phase 1 in which the toxicity of the treatment is tested up to phase 3 where the treatment is compared with the standard of cure, passing through phase 2 in which it is understood whether the drug proves to be effective.
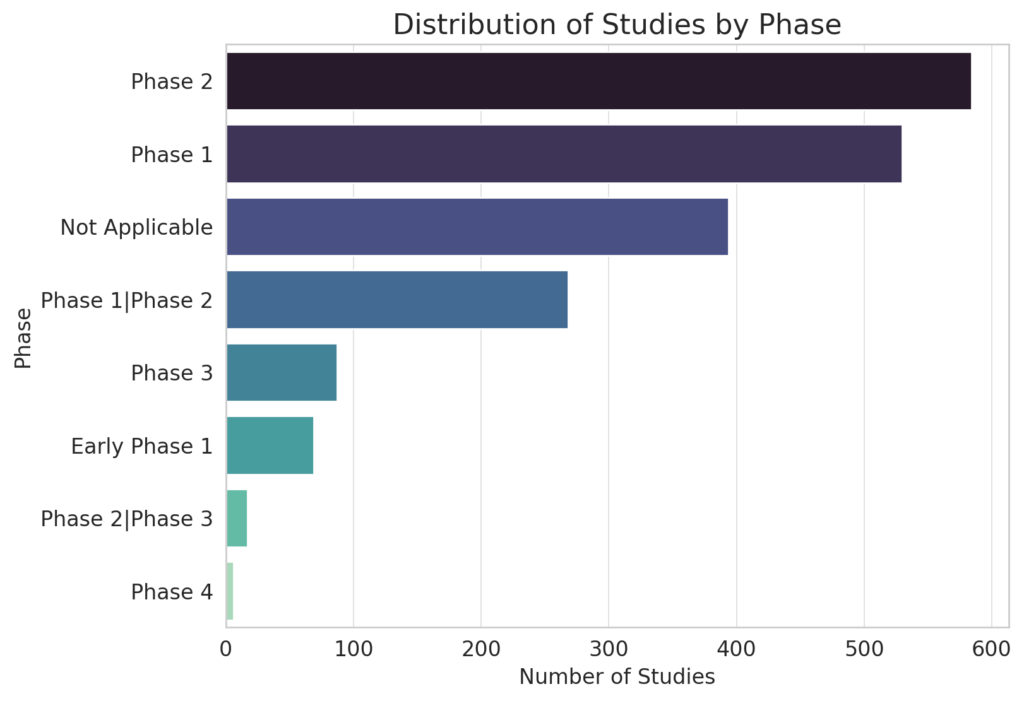
From this graph, where “Not Applicable” refers to observational studies where there is no obligation to define the phase, it is clear that few studies progress to phase 3. There are also many studies that are halfway between a phase and the other.
Another thing that seems very interesting to me is to understand whether glioblastoma is studied as a separate pathology or in combination with other tumors of the central nervous system. The following graph shows us what the situation is.
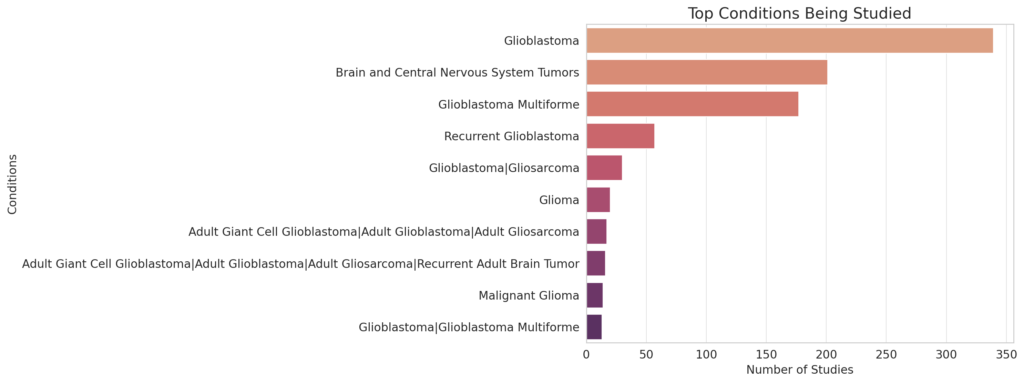
Here we understand how Glioblastoma is considered in its own right given its specificities which make it the complex disease we know. It is also interesting to understand who finances this research. The following graph gives us the answers.
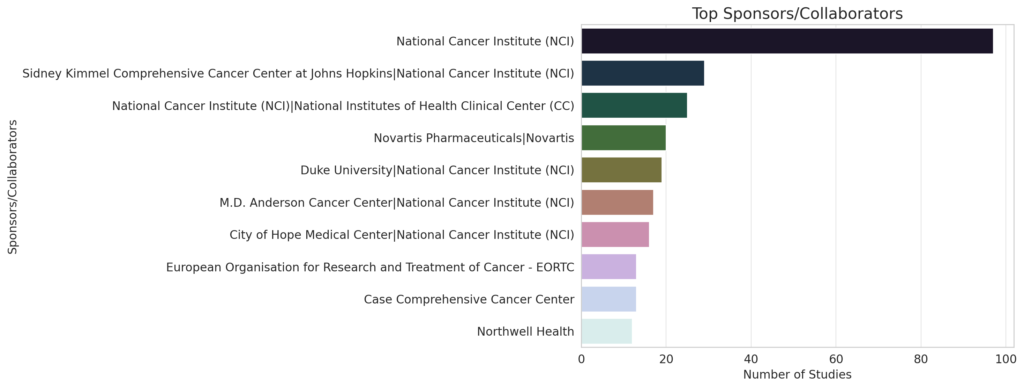
As you can see, national funding is fundamental here, pharmaceutical companies are certainly also present but given that it is a rare disease, it is not yet a business for pharmaceutical companies to invest in, partly due to the number relatively small number of patients, partly due to the extreme riskiness of the investment. This explains several things to us. I hope you enjoyed the article even though it is very different from the classic glioblastoma.it articles but believe me, it is full of interesting information.
Very interesting and good article. Do you happen to have information about the top collaborators in Europe?